The Importance Of Trusting The Camp Process
Trust the camp process – staged, transparent evaluations that protect wellbeing, support late developers, and boost retention.
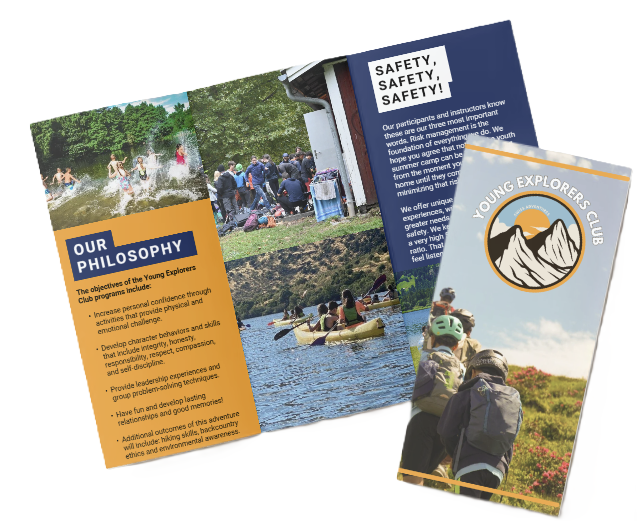
Trusting the Camp Process
Trusting the camp process means committing to a clear, multi-step approach: training camps, evaluation camps, tryouts, and ongoing development cycles. We avoid judging participants on a single event. That approach improves selection validity and protects health and well-being. It supports late developers. The resulting organizational trust boosts retention, participation, and long-term performance.
Key Takeaways
- Adopt a staged, transparent evaluation process with multiple timepoints and clear criteria. This reduces bias and increases predictive validity.
- Enforce procedural fairness with consistent rules, visible criteria, and timely, actionable feedback. That raises psychological safety, effort, and team buy-in.
- Require objective measurement and reporting—pre/post tests, sample sizes, effect sizes, retention rates. Use those figures to quantify development and justify decisions.
- Publish schedules, scoring rubrics, and feedback cadence. Make families and staff confident about selection, safety protocols, and next steps.
- Track KPIs for retention, satisfaction, team cohesion, and safety. Measure injury incidence per 1,000 exposures, NPS, and attendance. Adjust programs based on the data.
Practical next steps: Define criteria and timelines, set up objective testing and reporting templates, communicate the plan publicly, and monitor the core KPIs regularly to iterate and improve.
https://youtu.be/seKxX3KbGYw
What Trusting the Camp Process Looks Like, and Why It Matters
We define the camp process as the full sequence: training camps, evaluation camps, summer camps, tryouts and ongoing development cycles.
We use that sequence to develop skills, make selection decisions, build team chemistry, protect safety, and support long-term participant development. Trust the process means you believe in a transparent, multi-step system rather than judging outcomes on a single event.
Concrete examples help. NFL offseason rosters often begin at 90 players and shrink to a 53-player regular-season roster; average NFL career length ≈ 3.3 years (NFL Players Association). NBA preseason rosters can reach 20 players before settling at 15 plus two-way contracts. Those numbers show phased evaluation, steady roster churn, and why development cycles matter — players get multiple opportunities to grow and earn a spot.
Scale matters, too. Camps serve huge numbers: 11 million+ campers annually (ACA). That volume forces programs to standardize how they train, assess and protect participants. We design our processes so learning and wellbeing scale without sacrificing individual attention.
We expect three things from a trusted process:
- Clarity: criteria are visible, timelines are known and feedback is timely.
- Progression: athletes advance through stages that match skill and readiness, not emotion or favoritism.
- Safeguards: health, rest and psychological support are built into evaluations.
Practical signs we trust the process
Look for these behaviors; they show a camp truly values development and not just short-term wins:
- Coaches give regular, actionable feedback after each evaluation or camp event.
- Athletes move through clear development cycles instead of being cut after a single assessment.
- Programs measure both performance and wellbeing, with recovery and mental-skills work scheduled.
- Roster changes are explained publicly, with criteria tied to shared goals.
- Parents and participants can access progress reports and understand next steps.
- Staff training and consistent evaluation rubrics reduce bias and increase fairness.
- We track long-term outcomes — retention, skill gains and confidence — and adjust programs accordingly, which boosts emotional resilience via focused support and reflection.
When stakes are high — short careers, fierce competition and limited roster spots — trusting a staged, transparent process protects athletes and maximizes potential. We commit to processes that produce clearer selection decisions, healthier athletes and better long-term outcomes for every camper.

Why Trust Improves Outcomes: Psychology and Organizational Evidence
We, at the young explorers club, make procedural justice the backbone of our operations: transparent rules, consistent application, and clear criteria. Clear procedures reduce ambiguity, so staff and campers know what to expect and why decisions are made. We reinforce those norms in scheduling, staff training, and parent communications to keep expectations aligned.
Procedural justice fuels organizational trust and team buy-in. When participants perceive fairness in processes they increase compliance, effort, and long-term commitment. I see that play out in group activities and day-to-day camp life: teams cooperate faster, volunteers stay engaged longer, and campers attempt harder challenges because they trust the process and the people running it. Meta-analyses show a positive relationship between trust and performance; research consistently reports positive correlations between trust in leadership/process and team performance and commitment, and that pattern holds across educational and recreational settings.
We measure the outcomes tied to high trust and see predictable gains: higher attendance and participation rates, lower dropout, higher satisfaction scores, improved performance metrics, and reduced turnover among staff. Those outcomes make programming easier to scale and improve over time because fewer resources get eaten up by conflict, uncertainty, or churn. A transformational camp experience often depends on that stability; building it starts with fair, repeatable processes.
Mechanism: how fairness changes behavior
Fair procedures lower perceived threat. That drop in threat increases psychological safety and supports emotional resilience in kids and staff, which then motivates sustained effort and learning. We translate that into practice by explaining decisions aloud, using consistent feedback scripts, and inviting questions before and after activities. Those small rituals communicate respect and predictability, and they cut defensive reactions that would otherwise sap energy from learning and teamwork.
Practical organizational phrases and actions
Below are concise phrases and actions I use to align teams and communicate expectations:
- “procedural justice” — define and document rules before sessions.
- “organizational trust” — measure trust in regular surveys and act on trends.
- “team buy-in” — involve staff and campers in rule-setting where appropriate.
- “retention” — track attendance and follow up early on disengagement.
- “performance improvement” — link fair evaluation criteria to coaching conversations.
We use these phrases in training, emails, and debriefs so language matches behavior. That consistency matters: when language, process, and action align, trust grows quickly and outcomes improve. For practical guidance on strengthening resilience through fair practices, see our note on emotional resilience, and for how fair systems produce transformative experiences, consult our piece on the transformational camp.

Measuring Development: Metrics, Targets and Reporting Standards
We, at the young explorers club, insist on objective measurement so progress is clear and defensible. I recommend structured pre/post testing and follow-up checks to quantify baseline vs. post-camp change and track skill retention. Use both performance numbers and perception scales to capture physical and psychological development.
We require the following reporting elements in every outcome report. Always include sample size and statistical indicators; effect size is essential for interpreting real-world impact.
- Pre/post percentage change
- Sample size (n)
- Central tendency with dispersion (mean ± SD)
- p-values for inferential tests
- Effect size (Cohen’s d) to show practical significance
Use the following measurable metrics during pre/post testing:
Core metrics to collect
- Vertical jump (cm/in) — explosive power is easy to quantify.
- Sprint times (40-yard or 40m) — record electronic or hand-timed with protocol.
- Technical skill scores — passes completed per trial, shooting percentage, successful dribbles.
- Coach ratings (1–10) — standardized rubric for decision-making, positioning, intensity.
- Participant self-efficacy scores — validated scales or brief Likert inventories.
Target 10–25% measurable improvement in targeted physical metrics over a multi-week camp is a reasonable expectation for focused training blocks.
We include model reporting language so authors can replicate clear statements. For example: “Campers improved their 40-yard sprint by 0.12 seconds on average (–3.5% change; n=48; p<0.05; Cohen’s d=0.45), indicating a moderate training effect.” Use that sentence structure as a template and replace values with your data.
We recommend follow-up testing at 6–12 weeks to measure retention and decay. Report retention rates explicitly and give raw sample counts; an example format is “80% of initial gains retained at 6 weeks” when supported by your numbers. Emphasize both percentage improvement and absolute changes (seconds, cm, correct passes) so coaches and parents see both relative and practical gains.
I encourage linking outcome summaries to program philosophy and supervision standards; see our notes on transformational camps for alignment with long-term goals: transformational camps.

Selection, Evaluation and Reducing Bias Through Patience
We, at the Young Explorers Club, insist that selection rely on longitudinal evaluation rather than a single observation. Single-day tryouts reward short-term preparedness and anxiety management more than long-term potential. A league example makes this clear: NFL camp structure often opens with an initial roster up to 90 players and trims to a final roster of 53 players after several weeks of practice and scrimmages. That multi-week evaluation lets coaches spot trends, late bloomers, and fluctuations that a one-off test misses.
A simple metric helps quantify outcomes across years: camp-to-roster conversion rate = made roster / total invitees. Tracking that conversion rate annually shows whether our selection choices predict who actually succeeds. Low conversion rates with high early cut rates signal that our early filters may be discarding future performers.
Repeated measures and aggregated scoring raise predictive validity far above single-test ranking. I recommend combining multiple evaluation points and using a weighted average across drills, scrimmages and coach ratings. That blended approach balances objective skill metrics with situational judgment and character observations. It also improves scouting reliability by smoothing random noise and one-off effects.
Practical scoring approach and metrics
- Collect repeated measures: run the same drills and situational tasks across multiple days and environments, and record coach observations after each session.
- Define components and weights: assign weights to component scores (example: drills 40%, scrimmages 35%, coach ratings 25%). Those weights reflect what you value most and can be adjusted empirically.
- Compute composite scores: calculate a weighted average or composite score for each participant each week, then average those composites across the evaluation window.
- Monitor conversion-rate metrics: record camp-to-roster conversion rate = made roster / total invitees for each cohort and compare across years to assess selection efficiency.
- Track scouting reliability: compute test-retest correlations for your measures and the predictive correlation between composite scores and end-of-season performance. Lower correlations signal a need to increase observation points or refine instruments.
- Allow late developers to remain visible: set thresholds that permit movement between tiers during camp so late improvers can be promoted rather than permanently eliminated.
I place particular emphasis on transparent recordkeeping. Maintain a simple database that logs scores by date, context notes, and attendance. That trail helps separate true performance trends from noise caused by illness, travel fatigue or first-day nerves. When you correlate composite scores with final selections and later success, you’ll see which components carry the most predictive weight.
Patience reduces several common biases. It counters recency bias by weighing earlier and later observations. It limits halo effects because multiple raters and repeated measures dilute a single coach’s overconfidence. It reduces the penalty for showmanship in a single tryout and creates space for late developers to emerge. These gains translate into higher conversion rates for those you actually want on your roster.
We also watch intangible outcomes that matter beyond skill metrics, like group cohesion and resilience; those are often captured in longitudinal notes and post-camp reviews. For an example of how camps support those softer outcomes, see emotional resilience.

Team Cohesion, Culture and Safety: Metrics That Build Trust
We measure trust through clear culture metrics, team cohesion data and safety reporting. Trust grows when campers, parents and staff see transparent numbers and predictable processes. I track both feeling-based indicators and hard KPIs so decisions are evidence-driven and easy to explain.
Our emphasis on team cohesion is practical and measurable; for examples of activities that strengthen groups see team cohesion. I look for alignment between qualitative feedback and quantitative trends before changing policies.
Key quantitative and qualitative KPIs
Below are the main indicators I report regularly to show that the process is working:
-
Year-to-year retention rate (target 60–75% for popular youth camps). I track cohort retention by program and age group to spot early warning signs.
-
Retention rate and attendance: I report daily attendance and seasonal attendance trends to ensure participation matches capacity planning.
-
Overall satisfaction (goal >85%). I combine post-session surveys with exit interviews for context.
-
Net Promoter Score (NPS): Use an NPS question: ‘How likely are you to recommend this camp?’—report % promoters minus % detractors as NPS. NPS (good >30). I segment NPS by parent vs. camper for clearer action items.
-
Self-reported team cohesion scores. I use short validated scales on-site and at home to capture perceived group trust and cooperation.
-
Number of disciplinary incidents. I present counts and rates per 100 participant-days to make patterns visible.
-
Attendance patterns by day and activity to spot drop-offs or engagement gaps.
Safety metrics I publish to build credibility and to lower anxiety among families. I present injury data explicitly as numerator and denominator: X injuries per 1,000 athlete-exposures (AEs). I compare our figures to published benchmarks such as NCAA and NATA when available. Core safety items I track and report:
-
Injury incidence as X injuries per 1,000 AEs, including concussion incidence and time-loss injuries.
-
Emergency response drills completed (count and % of staff trained in last 12 months).
-
Certified staff ratios, for example “1 certified coach per X participants” listed by activity and age.
-
Incident-reporting turnaround time and corrective actions logged.
I publish these metrics on a regular cadence and tie them to action plans. That transparency reassures families and builds operational trust among staff.
https://youtu.be/2po0j_UFi_I
Communication, Feedback and Transparency: Practical Structures That Sustain Trust
We, at the Young Explorers Club, make transparent criteria the baseline for every camp. We publish an expectations document and a clear schedule before arrival. Staff share selection and safety rules, injury/safety protocols, and the feedback frequency parents can expect. That upfront clarity reduces confusion and builds confidence.
State the criteria and cadence in plain language. Use exact language so families know the math: “Evaluations shared weekly; criteria weights: 40% on-field performance, 30% coachability, 20% fitness, 10% attendance.” Publish the scoring method and weighting so selection decisions are reproducible. Include exact timeline and evaluation rubric; e.g., ‘Evaluations shared weekly; criteria weights: 40% on-field performance, 30% coachability, 20% fitness, 10% attendance,’ and reinforce: “Use at least 3 distinct evaluation timepoints (baseline, mid-camp, final)” in your published schedule so everyone sees the checkpoints. Share safety protocols up front, the incident-report steps, and the follow-up schedule for parent communication.
Operational KPIs keep the promise measurable. I recommend tracking:
- Feedback frequency: coach-participant feedback at least weekly.
- Average response time: 24 hours for parent inquiries.
- Documentation targets: 90% of families receive written evaluation within 7 days of camp end.
We set internal targets for coach workflows and audit them weekly. We log every parent message and measure response times. We require written incident summaries for injuries within 24 hours plus a same-day phone call for anything beyond minor scrapes.
Use structured feedback loops. Set three evaluation timepoints and stick to them. Use baseline to set expectations, mid-camp to correct course, and final to document outcomes. Use the phrase “Use at least 3 distinct evaluation timepoints (baseline, mid-camp, final)” in your published schedule so everyone sees the checkpoints.
Sample evaluation rubric and timeline
Below is a concise format to publish for participants and parents:
- Rubric (score 1–5): 40% on-field performance, 30% coachability, 20% fitness, 10% attendance. Include brief descriptors for each score band (e.g., 5 = exceptional understanding and effort; 3 = meets expectations; 1 = needs support).
- Publication language example: “Evaluations shared weekly; criteria weights: 40% on-field performance, 30% coachability, 20% fitness, 10% attendance.”
- Timeline to publish:
- Day 0: Expectations document and full schedule shared.
- Baseline (Day 1–2): initial assessment and parent-checkpoint.
- Mid-camp (halfway): written summary and coach meeting.
- Final (last day): full written evaluation; target—90% of families receive written evaluation within 7 days of camp end.
- Ongoing: weekly coach notes available to parents; average response time: 24 hours.
We also recommend linking practical resources about supervision to help parents prepare; see our guidance on camp supervision.

Sources
American Camp Association — The Value of Camp
National Collegiate Athletic Association — Graduation Success Rate (GSR)
NFL Players Association — Average NFL Career Length
Dirks & Ferrin — The Role of Trust in Organizational Settings
American Psychological Association — Procedural Justice (Monitor on Psychology)
National Athletic Trainers’ Association — Resources on Injury Surveillance and Prevention
NCAA Sport Science Institute — Injury Surveillance Program
Harvard Business Review — The One Number You Need to Grow
Net Promoter — What is Net Promoter Score (NPS)?
Journal of Sports Sciences — Aims & Scope

 14")