Math Camps: Making Numbers Fun Outdoors
Young Explorers Club: outdoor math camps combining hands-on measurement, teamwork and data to boost learning with measurable 10–20% gains.
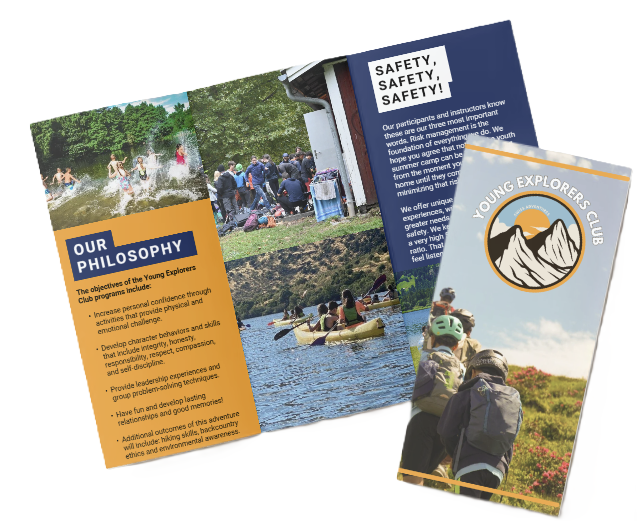
Young Explorers Club: Outdoor Math Camps
We, at the Young Explorers Club, run math camps that turn abstract math into physical, social, and applied learning. Short skill lessons sit inside extended outdoor projects that use measurement tools, data collection, and team problem-solving. This model boosts engagement, retention, and physical activity. It targets measurable learning gains of 10–20%. We’re tracking those gains with pre/post diagnostics, normalized-gain calculations, collaboration rubrics, and MVPA logs. Join us to see clear, measurable progress in outdoor math education.
Key Takeaways
Core approach
-
Outdoor math replaces seat time and worksheets with movement-based measurement projects, like tree-height surveys and trail mapping, that build spatial reasoning, data literacy, and teamwork.
-
Instruction pairs short, focused teaching with longer hands-on investigations so students collect real data, analyze results, and present solutions.
Assessment & metrics
-
Use a 15–20 question pre/post diagnostic to measure learning gains.
-
Compute normalized gain using the formula: (post − pre) / (100 − pre).
-
Apply 1–4 collaboration rubrics to rate teamwork and use MVPA logs to document physical activity.
-
Report both absolute and normalized gains for clear, comparable outcomes.
Program logistics
-
Offer day, residential, or pop-up models to fit community needs.
-
Target an 8:1 camper-to-staff ratio (use 6–8:1 for higher-risk tasks).
-
Require staff training and maintain clear safety and permit procedures.
Budget & inclusion priorities
-
Allocate 40–60% of the budget to staffing.
-
Budget equipment at roughly $1,500–5,000.
-
Reserve 10–20% of seats for scholarships and plan accessibility accommodations.
Problem statement, context & classroom vs outdoor contrast
We, at the Young Explorers Club, see engagement with abstract math falling as students face hours of passive seat-time and decontextualized problems. Many children want active, real-world math experiences that connect numbers to movement, measurement and choice. Our math camps respond to that gap by making math physical, social and applied.
Camp attendance shows the scale of opportunity: 10–15 million children attend camps annually in the U.S. (American Camp Association). Industry benchmarks for program length and daily time look like this: residential sessions often run 1–2 weeks, day camps range from one-week to multi-week formats, and daily day-camp hours typically span 6–8 hours. Those hours give us rich windows to embed math in sustained outdoor projects. I integrate core math practice with free play, guided measurement tasks and team problem-solving so kids gain skills and stay active.
I use outdoor learning to boost retention, motivation and 21st-century abilities like collaboration, spatial reasoning and data literacy. Our approach pairs short skill-focused instruction with longer, hands-on investigations — kids collect real environmental data, model it, and present solutions. The result: higher physical activity, deeper understanding and stronger engagement. Read more about the benefits of outdoor learning in our overview of outdoor learning.
Classroom vs outdoor experiential math — three clear contrasts
We’ll contrast three practical differences that shape how kids learn:
- Sitting vs exploring: Traditional classrooms often mean long seat-time and teacher-led explanations. Outdoors, kids move, observe and measure in context. Movement raises MVPA (moderate-to-vigorous physical activity) and attention, so learners stay alert and apply math to real sights and sounds.
- Worksheets vs measurement projects: In-class work frequently relies on isolated worksheets and drill. Outside, students run multi-step measurement projects — they collect samples or readings, analyze patterns, and build models with real tools like tape measures, clinometers and simple data loggers. I recommend rotating roles (recorder, measurer, analyst) so every child practices multiple math habits.
- Single-skill practice vs cross-disciplinary problems: Schools often isolate one skill at a time. Our outdoor tasks combine geometry, statistics, biology and mapping within a single challenge (for example: design a wildlife-friendly trail, estimate area, model population density, and present a map). Those integrated problems boost transferable thinking and teamwork.

Benefits: learning, cognitive, health & social outcomes
We, at the Young Explorers Club, prioritize outdoor learning because research on outdoor learning links experiential approaches to stronger engagement, retention, problem-solving and more positive STEM attitudes (Dillon et al.). Our reading of synthesis studies finds small-to-moderate positive academic effects when learning moves outside. I set realistic short-camp targets at 10–20% improvement in topic fluency or post-test scores for focused 1–2 week interventions.
Our sample pre/post comparison shows how that target plays out in practice. A group with a pre-test average of 60% and a post-test average of 72% has an absolute gain of 12 percentage points. That equals a 20% relative improvement versus the pre-test baseline. I calculate normalized gain as (post − pre)/(100 − pre) = (72 − 60)/(100 − 60) = 12/40 = 0.30, which signals a meaningful short-term learning boost.
We program physical activity to meet established guidelines. Camps deliver 30–45 minutes of structured moderate-to-vigorous physical activity (MVPA) through math-integrated games plus 15–30 minutes of exploratory active time, helping kids reach the 60-minute daily MVPA target recommended by WHO/CDC. Mixing movement with math sharpens attention and aids memory encoding, so I design challenges that alternate active problem-solving with brief reflection.
Our social and emotional outcomes are equally important. Data and field reports show measurable gains in teamwork, communication and independence at camp (ACA messaging). We also see reduced screen time and higher self-efficacy after multi-day outdoor programs. Short, active sessions that reward collaborative problem-solving build confidence quickly.
Key metrics to track
We track the following core indicators to evaluate short interventions:
- Pre/post academic scores (percent correct and normalized gain) aligned to target skills
- Engagement and retention measures (time on task, observed attention)
- Problem-solving performance (task completion rates and quality)
- MVPA minutes split by structured vs. free time
- Attendance and drop-off rates
- Collaboration rubric scores (1–4 scale) and a 5-item Likert attitude survey for STEM confidence
Measurement approach for short camps
We use a compact, practical measurement plan that fits tight schedules. Administer a 15–20 question diagnostic before and after camp, with items directly tied to the skills you practiced. Our rubrics for collaboration run 1–4 for clarity and speed. We pair those with a 5-item Likert attitude survey to capture shifts in confidence and interest.
Our assessment cadence stays simple. Run the pre-test on day one and the post-test on the final day. Record MVPA with short logs or wearable steps if available. Ask instructors to complete quick rubrics after each group activity to capture teamwork and communication trends. I recommend reporting both absolute point gains and normalized gains; both give different, useful views of learning.
We, at the Young Explorers Club, use these measures to make rapid, evidence-aligned decisions about activities and pacing. That keeps instruction focused, fun, and measurable.

High-impact outdoor math activities (materials & measurable outcomes)
Quick activity cards
Below are compact cards you can hand to leaders; each card lists grade range, time, group size, core materials and expected measurable outcome.
-
Tree Height by Similar Triangles — Grades 6–12; 45–60 min; groups of 3–6.
- Materials: Suunto clinometer (or similar), 50 m tape, protractor, calculator, waterproof notebook.
- Outcome: estimate within 10–15% of actual height.
- Script: learning goal; 10–15 min setup; measure baseline and angle; compute height and upload photo + raw data.
-
Trail Map Scale & Area — Grades 4–8; 60–90 min; groups of 3–6.
- Materials: Keson measuring wheel, graph paper, compass, Garmin eTrex GPS, pencils.
- Outcome: map area within 5% error.
- Script: define plot; calibrate wheel; draw scaled map; submit scanned map and area comparison.
-
Weather & Graphing — Grades 3–9; 30–45 min; groups of 3–6.
- Materials: Kestrel weather station, clipboards, Google Forms, waterproof notebook.
- Outcome: accurate summary stats and charts for temperature, wind and humidity.
- Script: demo Kestrel; collect repeated measures; enter timestamped data; produce mean/median and plots.
-
Math Orienteering (Score Orienteering) — Grades 5–9; 45–60 min; groups of 3–6.
- Materials: printed coordinate maps, compasses, stopwatches, point-value clue cards.
- Outcome: route-optimization and comparison of team efficiency.
- Script: place controls; plan and navigate; log times/coords; compare to theoretical optimal route.
-
Geodesic Measurement (Perimeter/Area) — Grades 6–12; 50–90 min; groups of 3–6.
- Materials: Keson wheel, Bosch GLM laser, 50 m tapes, waterproof notebook.
- Outcome: compare methods and report percent differences.
- Script: assign methods; run repeated trials; compute means and percent differences.
Data capture, analysis & reporting
We require raw trials, photos, and short-form responses for every activity. Use shared Google Sheets for raw entries and simple charts. Leaders should create a Google Form to collect timestamped measurements and photos in the field. Each activity needs a results row with mean ± SD and percent error (or percent difference between methods). Display a bar chart for method comparisons or before/after checks.
For assessments, we look for:
- Consistent raw-data formatting across groups.
- Clear audit trail: photos, calculation steps and Form responses.
- Statistics reported as mean ± SD and percent error; include sample size.
At setup, remind teams to run repeated trials (3+) where feasible so SDs are meaningful. Expect tolerances of roughly 5–15% depending on task; flag outliers and annotate probable error sources (angle misread, uneven baseline, GPS jitter). I monitor submissions and compare group summaries to spot teaching moments. We also link activity outcomes back to principles of outdoor learning to justify time-on-task and assessment choices.

Program design: models, scheduling, age- & grade-specific goals & staffing
Program types and parameters
I plan programs in three delivery models and set clear parameters for each. The options are:
- Day camps — 6–8 hours per day, with sessions that run from 1 to 8 weeks. Camper-to-staff ratio benchmark: 8–12:1, with 6–8:1 used for higher-risk activities.
- Overnight / residential — 24/7 supervision; a typical camp week equals seven days. Nighttime camper-to-staff ratio: 6–8:1, daytime ratio: 8–10:1.
- Pop-up / outreach — short 1–3 hour sessions in parks, schoolyards, or community spaces for targeted modules or family events.
I set a working rule of one instructor per eight campers for hands-on outdoor math that uses measurement tools. That ratio ensures each small group can access equipment safely and get guided feedback. We link our learning to practical outdoor contexts to boost engagement, drawing on proven benefits of outdoor learning.
Staffing, training, learning goals and a sample schedule
We staff to learning needs. Day programs aim for an 8:1 ratio; high-risk tasks use 6–8:1. Each 20 campers has at least one lead teacher with a formal math background. All staff complete background checks. Wilderness First Aid (WFA) and CPR certification are mandatory for supervising instructors. I require 16–24 hours of pre-camp staff training that covers safety protocols, curriculum delivery, and behavior management. Staff run a daily debrief of 15–30 minutes to refine instruction and address safety observations.
Age- and grade-specific goals guide activity length and outcomes. I keep objectives measurable and time-box sessions so outdoor constraints don’t dilute learning.
- K–2: Focus on number sense, shapes, and measurement using both non-standard and standard units. Time per activity: 20–35 minutes. Sample measurable objective: identify and compare lengths using standard units with 80% accuracy.
- Grades 3–5: Emphasize place value, fractions, area and perimeter, and basic data collection and graphing. Time per activity: 30–45 minutes. I push students to record field data and translate it to simple charts.
- Grades 6–8: Target proportions, percent, basic statistics, linear relationships, and geometric reasoning applied to the field. Time per activity: 45–60 minutes. Activities center on repeated measure-analyze cycles.
- Grades 9–12: Offer applied algebra, trigonometry (clinometer and distance problems), and multi-day project-based modeling. Time per activity: 50–90 minutes. I expect students to produce a field report or model that addresses a real problem.
Sample scheduling template (Day camp, Grades 6–8; 09:00–15:00)
- 09:00–09:30 — Warm-up & orientation (15–30 min): agreements, quick math warm-up that primes observational skills.
- 09:30–11:00 — Field station rotation A (60–75 min): measurement and orienteering activity with hands-on instruments.
- 11:00–11:30 — Snack/transition and quick reflective notes (15–20 min): students log observations.
- 11:30–12:15 — Data analysis station (45 min): compute summaries, create graphs, and interpret trends.
- 12:15–13:00 — Lunch & free play (45 min): informal social learning and unstructured exploration.
- 13:00–14:15 — Field station rotation B (60–75 min): mapping or long-form project work that builds on morning data.
- 14:15–14:45 — Synthesis & group presentations (30 min): teams present findings and methods.
- 14:45–15:00 — Daily debrief/cleanup (15 min): staff and campers reflect; staff log notes for next day.
I design longer hands-on blocks so students can complete full measure-analyze-model cycles. That structure, combined with dedicated data analysis blocks, makes outdoor measurements translate into formal math skills and transferable reasoning.

Assessment, measuring impact, safety & permits
KPIs, instruments and analysis approach
We set clear, quantifiable targets and use simple tools that work in the field. Below are core targets and sample instruments I use to measure learning and engagement.
KPI targets:
- Pre/post test scores: aim for a 10–20% improvement.
- Attitude surveys (5‑item Likert): target an average shift of +0.5 to +1.0.
- Participation/attendance: achieve >90% daily attendance across the camp week.
- Skill mastery rates: percent of groups meeting tolerances (for example, tree‑height measurement within ±15%).
Sample instruments:
- 15‑question multiple‑choice pre/post diagnostic administered on day 1 and day 5.
- 5‑item Likert attitude survey given pre and post.
- 1–4 collaboration rubric filled by staff after each group activity.
- Photo‑documentation log to validate process skills and mastery.
Analysis approach: I compute normalized gain as (post − pre) / (100 − pre). Use that to compare relative improvement when initial scores vary. For cohorts with n > 20, run a paired t‑test to check significance. If n ≤ 20, report mean ± SD and percent improvement; avoid overinterpreting small samples.
Recommended visuals:
- Before/after bar chart for concept gains.
- Radar chart for multiple skill dimensions.
- Method‑comparison bars to show which activities produced the largest gains.
When tracking attendance and mastery, display daily heatmaps so staff can spot dropouts or groups that need immediate intervention. Keep raw data and coded rubrics in a simple spreadsheet so you can compute normalized gain and run the paired t‑test quickly after camp.
Safety, permits and on‑site logistics
We, at the Young Explorers Club, treat safety as integrated program data. Every activity plan pairs learning objectives with a risk control and a response metric.
Minimum on-site requirements:
- One first‑aid kit per group, plus staff with current first‑aid certification.
- Each staffer carries a communication device (cell phone) and we keep a backup radio for low‑coverage areas.
- Monitor weather continuously and enforce sunscreen and hydration policies; staff check water bottles and reapply sunscreen at set intervals.
- All medication and medical forms stay on file with designated staff; medication is administered only by trained personnel.
Permits and insurance: Permits and insurance must be settled before arrival. Obtain park or site permits where required, confirm site‑specific rules, and carry general liability insurance. I verify restrictions during the pre‑trip site assessment and log them in the hazard register.
Emergency metrics and policies are simple and measurable. Lead staff handle initial care within <5 minutes. If lightning is observed or thunder heard, clear the field in under 2 minutes and move to a predetermined shelter (vehicle or building). If a condition exceeds staff capability, staff call emergency services immediately.
Operational briefing line (used in all field briefings):
“If lightning is observed or thunder heard, clear the field in under 2 minutes and move to predetermined shelter. Lead staff to manage first aid; call emergency services if condition exceeds staff capability.”
Pre‑departure minimum checklist:
- Completed pre‑trip site assessment
- Current hazard log
- Emergency contact list
- Medication forms
- Heat/UV mitigation plan
- Staff certification list
I also document response times during drills so we can measure and improve our emergency readiness.
For program framing and activity design I draw on proven principles of outdoor learning, which helps keep math active, social and safe in natural settings.

Budgeting, equipment, partnerships, marketing & inclusion
We, at the Young Explorers Club, build math camps that balance rigorous learning with outdoor play. I plan budgets so program quality isn’t a casualty of cost cuts. I invest first in staff and safety, then in tools that let numbers come alive outside. I use clear per-camper benchmarks to price programs and to justify sponsorship asks.
Core equipment, classroom supplies and digital tools (sample counts)
Below are starter counts for a cohort-sized inventory and the classroom/digital items you’ll need:
- Tape measures 50 m — x6
- Keson measuring wheels — x2
- Bosch GLM laser measurers — x2
- Suunto clinometers — x2
- Garmin eTrex handheld GPS — x3
- Kestrel anemometer — 1 per group
- Clipboards — 1 per camper
- Waterproof field notebooks — 1 per camper
- Graph paper, protractors, compasses — shared classroom sets
- Calculators/tablets — 1 per small group or 1 per camper depending on activity
- Digital tools: GeoGebra, Desmos, Google Forms/Sheets, Kahoot, Seesaw, ArcGIS Online
I recommend starting with a shared-tool inventory cost of roughly $1,500–5,000, then scale digital licenses as usage grows. Consumable kits per camper should run $50–100 to cover basic supplies and replacement wear.
Budgeting notes and line-item targets
- Staff should command the largest share. Aim for 40–60% of budget on staffing to keep adult-to-child ratios low and programming tight.
- Facilities and permits often take 10–20%. Plan site fees early; they fluctuate by season.
- Equipment fits in the 5–10% band if you amortize purchases over multiple seasons.
- Food and transport generally run 10–15%. Add contingency for remote trips.
- Insurance and admin typically occupy 5–10%.
Pricing benchmarks
Pricing benchmarks help position your program:
- Low-cost day programs: $150–$350 per camper per week.
- Mid-range day camps: $300–$600 per week.
- Residential/overnight: $500–$1,500+ per week.
Funding and partnerships — practical moves I use
- Target 10–30% of program budget from external grants, sponsorships, or in-kind partners.
- Approach parks departments and local universities for site support and guest instructors.
- Teacher-prep programs and STEM nonprofits often provide volunteers or curriculum co-development.
- Negotiate equipment loans and reduced permit fees in exchange for co-branded outreach or youth workshops.
Marketing and recruitment — messages that convert
Lead with hands-on outcomes and clear benefit language:
- Use phrases like “hands-on math”, “outdoor STEM camp”, “real-world problem solving”, “experiential math”.
- Use email conversion as your baseline metric (expect 2–5%). Social ad click-to-signup will be lower (0.5–2%).
- Optimize landing pages and add clear calls to action to lift conversion rates.
- Reinforce learning value with short video clips of real activities and testimonials. Mention follow-up supports to improve return rates.
Inclusion, accessibility and scholarship strategy
- Reserve 10–20% of seats for scholarships aimed at low-income families. Offer transport stipends where possible.
- Build accessibility into route planning: map wheelchair-accessible routes and provide sensory accommodations.
- Share pre-visit materials so families and staff can prepare.
- Track accommodations in registration so instructors can adapt activities ahead of time.
Long-term tracking and retention
- Aim for a 40–60% return rate as a sign of program stickiness.
- Implement a follow-up cadence: immediate post-camp feedback, a 3-month check-in, and a 6–12 month survey to measure elective enrollment and self-reported STEM interest.
- Use Google Forms/Sheets to aggregate responses and spot trends.
For curriculum inspiration and to help frame program benefits, use outdoor learning as a parent-facing resource that explains why taking math outside matters.
Sources
American Camp Association — Research & Reports
American Camp Association — The Power of Camp
Natural England / UK Government — Evidence and Research on Outdoor Learning
Richard Louv — Last Child in the Woods: Saving Our Children from Nature-Deficit Disorder
Frances E. Kuo / Landscape & Human Health Lab — Research and Publications
Centers for Disease Control and Prevention (CDC) — How much physical activity do children need?
World Health Organization (WHO) — Physical activity
National Summer Learning Association — Research & Evidence
GeoGebra — GeoGebra (interactive mathematics software)
Desmos — Desmos Graphing Calculator
Esri — ArcGIS Online: Mapping & Analysis
Bosch — GLM Laser Measure (product information)
Garmin — eTrex Handheld GPS (product page)
Kestrel / NK — Handheld Weather Meters (product information)