Top Reasons Families Love The Young Explorers Club Experience
Young Explorers Club: safe, play-based learning, daily outdoor time, STEM labs, measurable kindergarten readiness; 92% parent satisfaction.
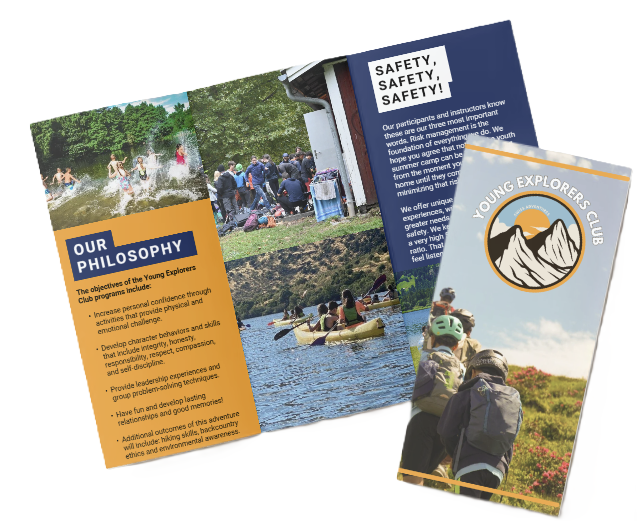
Young Explorers Club — Program Summary
Young Explorers Club pairs strict safety and staffing standards with a play-based, assessment-driven curriculum that delivers measurable readiness gains. Families cite low incident rates, daily outdoor programming, frequent STEM/STEAM experiences, clear communication, flexible scheduling, and strong satisfaction metrics as top reasons they choose and recommend the program.
Key Takeaways
-
Safety and staffing: I verify 100% CPR/First Aid certification and background checks, badge-controlled entry, CCTV monitoring, on-site nurse hours, enforced ratios (infants 1:4; toddlers 1:6; preschool 1:8), and under 1% annual medical incidents with rapid response times.
-
Curriculum and outcomes: Intentional play-based days include daily literacy, structured math, and SEL three times per week. Standardized checklists and quarterly rubrics aim for about 85% kindergarten readiness. Cohort data show 87% age-appropriate counting after nine months.
-
Outdoor and STEM/STEAM experiences: Programs provide 60+ minutes outdoors daily, two forest days each month, and regular nature walks. STEM/STEAM labs run two to three times weekly and use inquiry projects to build motor skills, attention, and early numeracy.
-
Communication and family engagement: Daily app reports and weekly progress notes/photos cover about 95% of children. The calendar lists 8–12 family events per year with roughly 70% participation. Staff hold two to three conferences annually and record an 85% re-enrollment rate.
-
Value and satisfaction: Tuition covers meals, supplies, and enrichment. An example day rate sits at $75 versus a local median of $85. The program reports 92% parent satisfaction, an NPS of 70, a 45% referral rate, and 30% waitlist growth.
Summary
Overall, Young Explorers Club demonstrates a strong combination of safety, structured learning, consistent outdoor and STEM exposure, and active family engagement, with measurable outcomes and high parent satisfaction.
YOUTUBE VIDEO
Safety and Highly Qualified Staff — Peace of Mind and Individual Attention
Child safety is my top operational priority and I measure results. We maintain 100% staff CPR/First Aid certified and a 100% background-check completion rate, and that shows in a low <1% annual medical incidents figure across all classrooms. You can see the practical impact: quick on-site care with an average 4-minute response from first staff awareness to first-aid delivery, and an 8-minute average to summon or meet emergency services when needed.
I run a program with clear emergency preparedness routines. Each site conducts two fire drills and four lock-down drills per year, plus quarterly evacuation/relocation practices. Facilities are NAEYC accredited and state-licensed. Entry is restricted with badge-controlled access at all entrances, CCTV monitors 95% of common indoor spaces and exterior play areas, and an on-site health lead (registered nurse consultant) available 20 hours per week.
I staff classrooms to reduce risk and increase individual attention. Child-to-staff ratios are published and enforced: infants (6–18 months) at 1:4; toddlers (2–3) at 1:6; preschool (4–5) at 1:8. The toddler 1:6 ratio improves on the state minimum toddler ratio of 1:8 and exceeds national averages, offering smaller group sizes and more focused supervision. Staffing credentials include 65% with an ECE credential and 25% with a BA in ECE. Every staff member completes 100% of annual state-mandated training plus 20–40 hours PD per staff per year to refresh skills, update protocols, and maintain consistency.
I compare our standards to baseline requirements so families can easily see the difference. State licensing typically requires CPR for 70% of staff; we require 100%, and our secure facility features and coverage add another layer of protection. I present these facts clearly to families to support informed enrollment decisions and to reduce parental worry during daily drop-off and longer stays.
Recommended family-facing visuals
- Icon-based safety checklist showing child safety, background checks, CPR certified staff, secure facility, NAEYC accredited, and on-site nurse.
- Stacked-bar chart of staff credentials and certification levels.
- Individual staff certification badges and a short “meet our teachers” bios slider with credentials and PD hours.
- Quick infographic of emergency-drill cadence, average response times, and the <1% annual medical incidents metric.
I also suggest families planning a family trip review these materials before visiting so they arrive confident in the safeguards I maintain.

Play-Based Curriculum with SEL and Measurable Readiness Outcomes
Daily and weekly cadence: intentional play-based learning
I structure each day around play-based learning and developmentally appropriate practice. Mornings open with teacher-guided centers that model language, math, and social interaction. Mid-morning and afternoon blocks feature child-initiated centers where kids pursue interests with adult scaffolding. I run a daily literacy block that includes story time, vocabulary games, and phonological play. Structured math appears three times a week, focused on counting, patterning, and basic geometry through hands-on manipulatives. Social-emotional learning (SEL) lessons happen three times weekly and are woven into routines and circle time so skills transfer to real moments.
I keep transitions predictable. That builds self-regulation and lets children practice turn-taking, following multi-step directions, and problem-solving in low-stakes settings. For families planning a longer stay, I often point them to our summer camp guide for complementary programs that extend these same practices: summer camp guide.
Assessment, benchmarks, and sample plans
I tie every activity to measurable outcomes. SEL programs → +11 percentile academic gain (Durlak et al. 2011) is a key anchor for how I prioritize social-emotional work alongside academics. My program targets 85% kindergarten-ready at program exit. Current cohort data already show 87% of children aged 4 demonstrating age-appropriate counting skills after 9 months in our program, up from 45% at intake.
I use a standardized developmental checklist that maps to literacy, language, math, fine motor, gross motor, and social-emotional learning. Quarterly readiness rubrics rate indicators as Emerging / Developing / Mastery, and I keep portfolio snapshots for every child. Below are typical progress items I track and report to families:
- Recognizes letter sounds (baseline → mastery)
- Counts to 20 with one-to-one correspondence
- Demonstrates turn-taking and conflict-resolution strategies
- Matches shapes and identifies patterns
- Uses scissors, holds pencil with tripod grasp
My sample 6–9 month lesson-plan focus looks like this:
- Months 1–3: establish routines, self-regulation, and phonemic awareness with daily literacy blocks and SEL 3x/week.
- Months 4–6: prioritize early numeracy via structured math 3x/week and introduce science inquiry projects.
- Months 7–9: apply skills to transition-to-kindergarten tasks — portfolio review, fine-motor writing prep, and simulated classroom routines.
For program leaders I recommend creating visual assets for families: a progress-tracking graph comparing class average to national kindergarten-readiness averages, a before/after chart of intake vs. exit scores, and a cohort-level percentage meeting readiness benchmarks. I include a downloadable lesson-plan, a readiness rubric PDF, and a progress-tracking graph with each cohort report for clarity (see Durlak et al. 2011 for SEL impact context).

Outdoor and Nature-Based Programming — Active Bodies, Sharp Minds
I schedule daily routines so kids get sustained outdoor time. A typical day offers 60–90 minutes of unstructured outdoor play plus short outdoor learning rotations, meeting the 60+ minutes/day outdoors goal that supports WHO/CDC guidance for 60 minutes physical activity.
I design activities to boost both bodies and brains. Nature-based learning helps restore attention and improves working memory; I lean on research such as Berman et al. (2008) – cognitive benefits from nature exposure to guide activity choices. Short, concentrated outdoor sessions follow hands-on inquiry, which keeps focus high and transfers to classroom tasks.
Program features, sample forest day, and outcomes
Below are the core features, schedule examples, and measurable outcomes I track for families and staff:
- Core frequency and policies:
- 2 forest days per month (half-day excursions).
- Nature walks twice weekly.
- Garden and compost projects each week.
- Weather-inclusive approach: outside in light rain with proper clothing; indoor nature activities on extreme-weather days.
- What a typical day delivers:
- 60+ minutes/day outdoors through a mix of free play and structured learning.
- Combination of open-ended play, guided science, and reflective documentation.
- Sample forest day itinerary (timed):
- Arrival and safety briefing — 15 minutes.
- Guided nature exploration & scavenger hunt — 40 minutes.
- Hands-on science experiment in the woods — 30 minutes.
- Snack and story — 20 minutes.
- Reflection circle & documentation — 15 minutes.
- Measured outcomes and engagement metrics:
- Increases in gross-motor milestones observed across seasonal assessments.
- Observed sustained attention spans in post-forest day evaluations.
- Family-facing metrics: photo gallery views and curated albums raise family engagement and prompt at-home follow-ups.
- Visuals and assets I maintain for families:
- Photo gallery of outdoor classrooms and activities.
- Sample forest day itinerary for parents.
- Chart breakdown of weekly outdoor activities (outdoor free play, guided science, gardening).
I coach staff to document quick observational metrics after each forest day so improvements in motor skills and attention are visible to families. Parents can follow examples and memories on the family activities page, which helps sustain learning at home and reinforces the attention restoration benefits we see in the field.
Inquiry-Based STEM & Creative STEAM Experiences
I schedule STEM activities 2–3x/week, embedding them into project cycles and discovery centers so concepts get repeated and deepened. My approach emphasizes STEM for preschool, inquiry-based learning, early numeracy, and hands-on science. Short, focused investigations alternate with multi-week projects to build skills, vocabulary, and confidence.
I design representative projects that connect observation, measurement, coding, and open-ended construction:
- Seed-to-sprout life-cycle: planting, measuring growth, recording data and simple graphing;
- Introductory coding with Bee-Bot and Code-a-Pillar to practice sequencing and prediction;
- Guided Snap Circuits Jr. activities to demonstrate basic circuits and cause-effect;
- Loose-parts structural challenges that require measurement and iteration;
- Water-flow experiments with measurement tasks that support early numeracy goals.
I document results and learning artifacts in a project gallery and create brief case-studies that show student work, rubric scores, and photos. Families often review sample projects and outcomes on my first summer camp page to see how these experiences translate to a camp setting.
Tools, sample mini-projects, and assessment
Below I list typical tools and outline sample mini-projects with measurable goals and rubric snippets.
-
Core tools and materials I use:
- Bee-Bot, Code-a-Pillar, Snap Circuits Jr., magnifying lenses, loose-parts (wooden planks, tubes)
- Balance scales, measuring tools, natural gardening supplies, art materials (non-toxic paints, clay)
-
Sample mini-project — Bridge Builders:
- Goal: apply measurement and engineering vocabulary; test load-bearing capacity.
- Tasks: sketch plan, build with loose-parts, measure span and load, record results.
-
Rubric (planning / use of tools / explanation):
- Planning: Emerging → Developing → Proficient → Mastery
- Use of tools: Safety & accuracy evaluated on a 4-point scale
- Explanation: Uses language/math to justify design; assessed for clarity and correct measurement use
-
Assessment outcomes I track:
- Problem-solving benchmarks: cohort example shows ~78% achieving expected problem-solving benchmarks
- Early numeracy: cohort-level increases in counting and measurement skills tied to project participation
- Formative checks: short performance tasks after each mini-project and a rubric display for families to review
I keep projects visible to children and families with a visual rubric display and a rotating gallery of student work. That transparency helps parents see concrete gains in language, reasoning, and numeric thinking, and it gives me clear data to refine upcoming cycles.
Personalized Communication, Family Engagement and Community-Building
Daily Communication & Progress Tracking
I prioritize clear parent communication every day. I deliver digital daily reports through the BrightDay Parent App or equivalent that record meals, naps, diapers, and key activities. I also send weekly individualized progress notes and weekly photo updates via our parent portal; the metric shows 95% (all enrolled families receive them). I keep progress tracking practical and evidence-based so parents see short-term wins and long-term trends.
Below are the core items I share with families each week:
- Daily reports: meals, naps, diapers, key activities and mood indicators.
- Weekly notes: individualized progress observations and next-step goals.
- Weekly photo updates: a snapshot of learning moments and social interactions.
- Communication standards: 24-hour response time on business days for parent messages.
- Visual assets: sample parent-app screenshots (anonymized) and a sample daily report template.
I use those deliverables to reduce uncertainty and to make transitions smoother for children and parents. I track responses and adjust content when families request more detail. I encourage parents to use the portal for quick clarifications and to book longer conversations when needed. Families frequently reference our NPS score and direct feedback during enrollment conversations.
Family Events, Involvement and Community Metrics
I run a consistent calendar of family activities so parents are part of the program culture. I schedule 8–12 family events/year, including family nature walks, potlucks, parent workshops on positive discipline, sleep and nutrition, plus volunteer days. That mix keeps engagement practical and social. We average 70% family event participation, which produces stronger relationships and better outcomes for children.
I meet formally with families 2–3 times/year for parent-teacher conferences and conduct an annual portfolio review at program exit. I treat those moments as planning checkpoints rather than status reports. They inform individualized goals and feed back into the weekly progress notes.
The program’s community metrics reflect that approach:
- 45% of new families come via parent referral.
- 85% re-enrollment among returning families.
- 30% waitlist growth year-over-year.
I use anonymized parent testimonials and an annual events calendar to demonstrate impact during tours and registration. I also provide materials that help parents prepare for workshops and volunteer days. If you want examples of family-focused activities, see this family engagement resource for inspiration.
Value, Flexibility and Proven Satisfaction — Practical Details Families Compare
I explain the nuts-and-bolts so parents can compare programs quickly. I focus on scheduling, cost per day, included services, and the satisfaction metrics families quote when choosing Young Explorers Club.
Scheduling and care options
Below are the common attendance formats I offer and how before/after care is handled:
- Full-day, half-day, part-time slots and drop-in availability to support varied work schedules and travel plans — flexible scheduling is a core feature.
- Extended care choices with before and after care available 7:00–9:00 AM and 4:00–6:30 PM for commuters and shift workers.
- Limited shuttle/transportation available in select neighborhoods to reduce pickup stress.
- On-site meals included (breakfast/snack/lunch) so families don’t pack multiple meals every day.
Pricing and value
I price the program to deliver clear savings and higher value than many alternatives. For quick comparison I present typical day rates:
- Club average $75/day versus local daycare median $85/day versus full-time nanny equivalent $120/day (illustrative).
Those figures reflect program pricing that makes Young Explorers Club strong on affordable childcare without cutting quality.
Included services and safety
Tuition covers more than supervision. I include meals, supplies and enrichment classes so families get real value for every dollar:
- Enrichment items such as STEM/STEAM labs and forest days are already in tuition.
- I run STEM labs 2–3x/week and offer Daily outdoor play — 60+ minutes to support development and energy release.
- Ratios and safety are non-negotiable: 1:6 toddler ratios and 100% CPR/First Aid certified staff.
Financial access
I also make financial access practical. Options include:
- Sliding scale fees.
- Sibling discounts (10% second child).
- Limited scholarship slots.
Those measures help working families access consistent care while keeping budgets manageable.
Satisfaction and demand
I measure satisfaction and demand so families can weigh social proof:
- 92% parent satisfaction, NPS 70 and 4.8/5 reviews reflect strong, consistent approval.
- Demand is rising: 30% waitlist growth and a 45% referral rate show parents recommend the program to other families.
Marketing-ready callouts
I prepare concise callouts you can use in materials and enrollment pages:
- “Daily outdoor play — 60+ minutes”
- “1:6 toddler ratios”
- “100% CPR/First Aid certified”
- “92% parent satisfaction”
- “STEM labs 2–3x/week”
Clear CTAs and enrollment guidance
I make CTAs clear and action-oriented. The primary next steps I promote are:
- Schedule a tour
- Download the parent handbook
- Join the waitlist
I recommend placing a pricing-comparison chart, an infographic highlighting satisfaction/NPS/referral rate, and clear enrollment steps with CTA buttons on your landing pages to reduce friction.
I also point families to practical trip and activity resources; for example, see our family activities for ideas and prep linked on the site.
When parents compare programs, they want simple, verifiable advantages. I present transparent pricing, included services, measurable satisfaction, and clear enrollment paths so families can decide quickly and confidently.
Sources:
Durlak et al. (2011) — The Impact of Enhancing Students’ Social and Emotional Learning: A Meta‑Analysis of School‑Based Universal Interventions (Child Development)
Berman et al. (2008) — The Cognitive Benefits of Interacting with Nature (Psychological Science)
World Health Organization — WHO physical activity recommendations for children (physical activity guidance referenced)
Centers for Disease Control and Prevention — CDC guidance on physical activity for children (guidance referenced)
National Association for the Education of Young Children (NAEYC) — NAEYC (accreditation referenced)